VIDEO SERIES
Integration kick-start:
MUnits and Functional Testing within the CI/CD pipeline
Episode 3
MUnits and Functional Testing within our CI/CD pipeline
Are you already using MUnits and Functional Testing within your CI/CD pipelines?
If not, then you should; they are a great helping hand at building stable APIs. By running automated MUnit tests for new and existing features as part of the Jenkins, issues are highlighted at an early stage. The same applies to Functional Monitor tests that are run post-deployment; they ensure that the new changes made have not impacted the general 'health' of the API. This again ensures that any errors are highlighted early on in the development.
Watch this episode to see how high-level unit testing and functional monitoring testing can be used within a CI/CD pipeline.
In our previous video, we looked into each of Infomentum's Jenkins pipelines and showed the different stages within those pipelines. Our manual build and deploy pipeline had a stage where we ran MUnit tests against the code base and a further stage that triggered off a Functional Monitor Test from within Anypoint Platform. In this video, we go into these in a bit more detail.
So with our manual build and deploy, the Jenkins pipeline code is held in our BitBucket repository. If we go down to the Build & Test stage, we see that kicking off the MUnit process is a simple maven command where the build and test are run as part of the 'package' phase. All we then have to do is specify details of how to publish the MUnit test results.
.png?width=800&name=Dipan%20video%203%20image%202-min%20(4).png)
A tip: Within this phase, you can set up Slack notifications. As soon as the MUnit tests have run, it will send a message with a summary of the results.
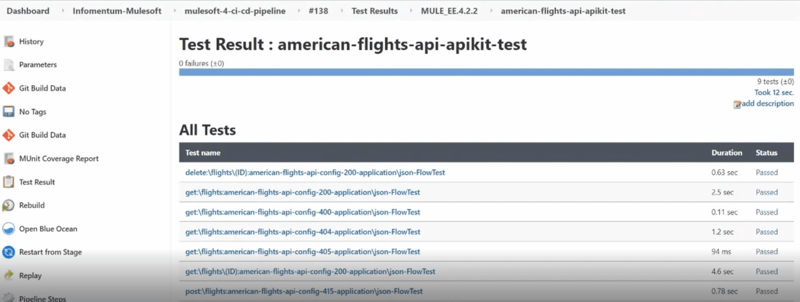
Once the pipeline has executed, we receive a link to a quick summary of the Latest Test Results, which shows how long the specific MUnit tests have taken and which ones have passed. We also get a MUnit Coverage Report which shows us the code coverage we are capturing with our MUnit tests. As we go through, we can see what the coverage is for each file and each flow.

Back on to BitBucket. The final stage of our pipeline is running a Functional Monitor test, which gets triggered after the API is deployed into CloudHub. A Functional Monitor test ensures the quality and reliability of your API by validating the behaviour of the API. MuleSoft Platform APIs can be used to trigger different actions, for example deploying APIs into CloudHub or kicking off a Functional Monitor test in Anypoint Platform. The latter you can see in the video. It's pretty easy; all you need to do is specify which Functional Monitor test you would like triggered with a specific version. When calling the platform APIs, you must select other standard MuleSoft parameters such as organisation id and access token. These have all been configured in a properties file to make updating to newer versions and different organisations easier.
If we look at the Functional Monitoring section in Anypoint Platform, we can see our test that gets triggered off as part of the build. This test is straight forward, as we are simply checking the HTTP response of an API call. But that's not all that these tests can do! You can expand the tests to suit the needs of the API itself to test its quality. We also show an example of a test where we make a few more assertions. This functional monitor is available via our MuleSoft Knowledge Base and can easily be migrated to other organisations to get their Functional Monitoring started with a baseline.
Our monitor that gets triggered off from the CI/CD pipeline has also been triggered to send a Slack notification if any errors occur as part of running the test. This provides immediate feedback on the status of the API once it has been deployed and ensures the quality and reliability of the API is maintained.
What we go through in the video is a framework - something our clients can use as a starting point and further tailor it to their specific needs. These assets will help speed up the testing process and build stable APIs!
Thank you for watching, and tune into our other videos in the series! If you are looking for more information on MUnit testing, check out our recent blogs: Testing made easy with MUnit and MuleSoft TDD with the use of MUnit.

